Instead of Excel
Speed
Rust and Polars under the hood — built for large datasets, not spreadsheet ceilings.
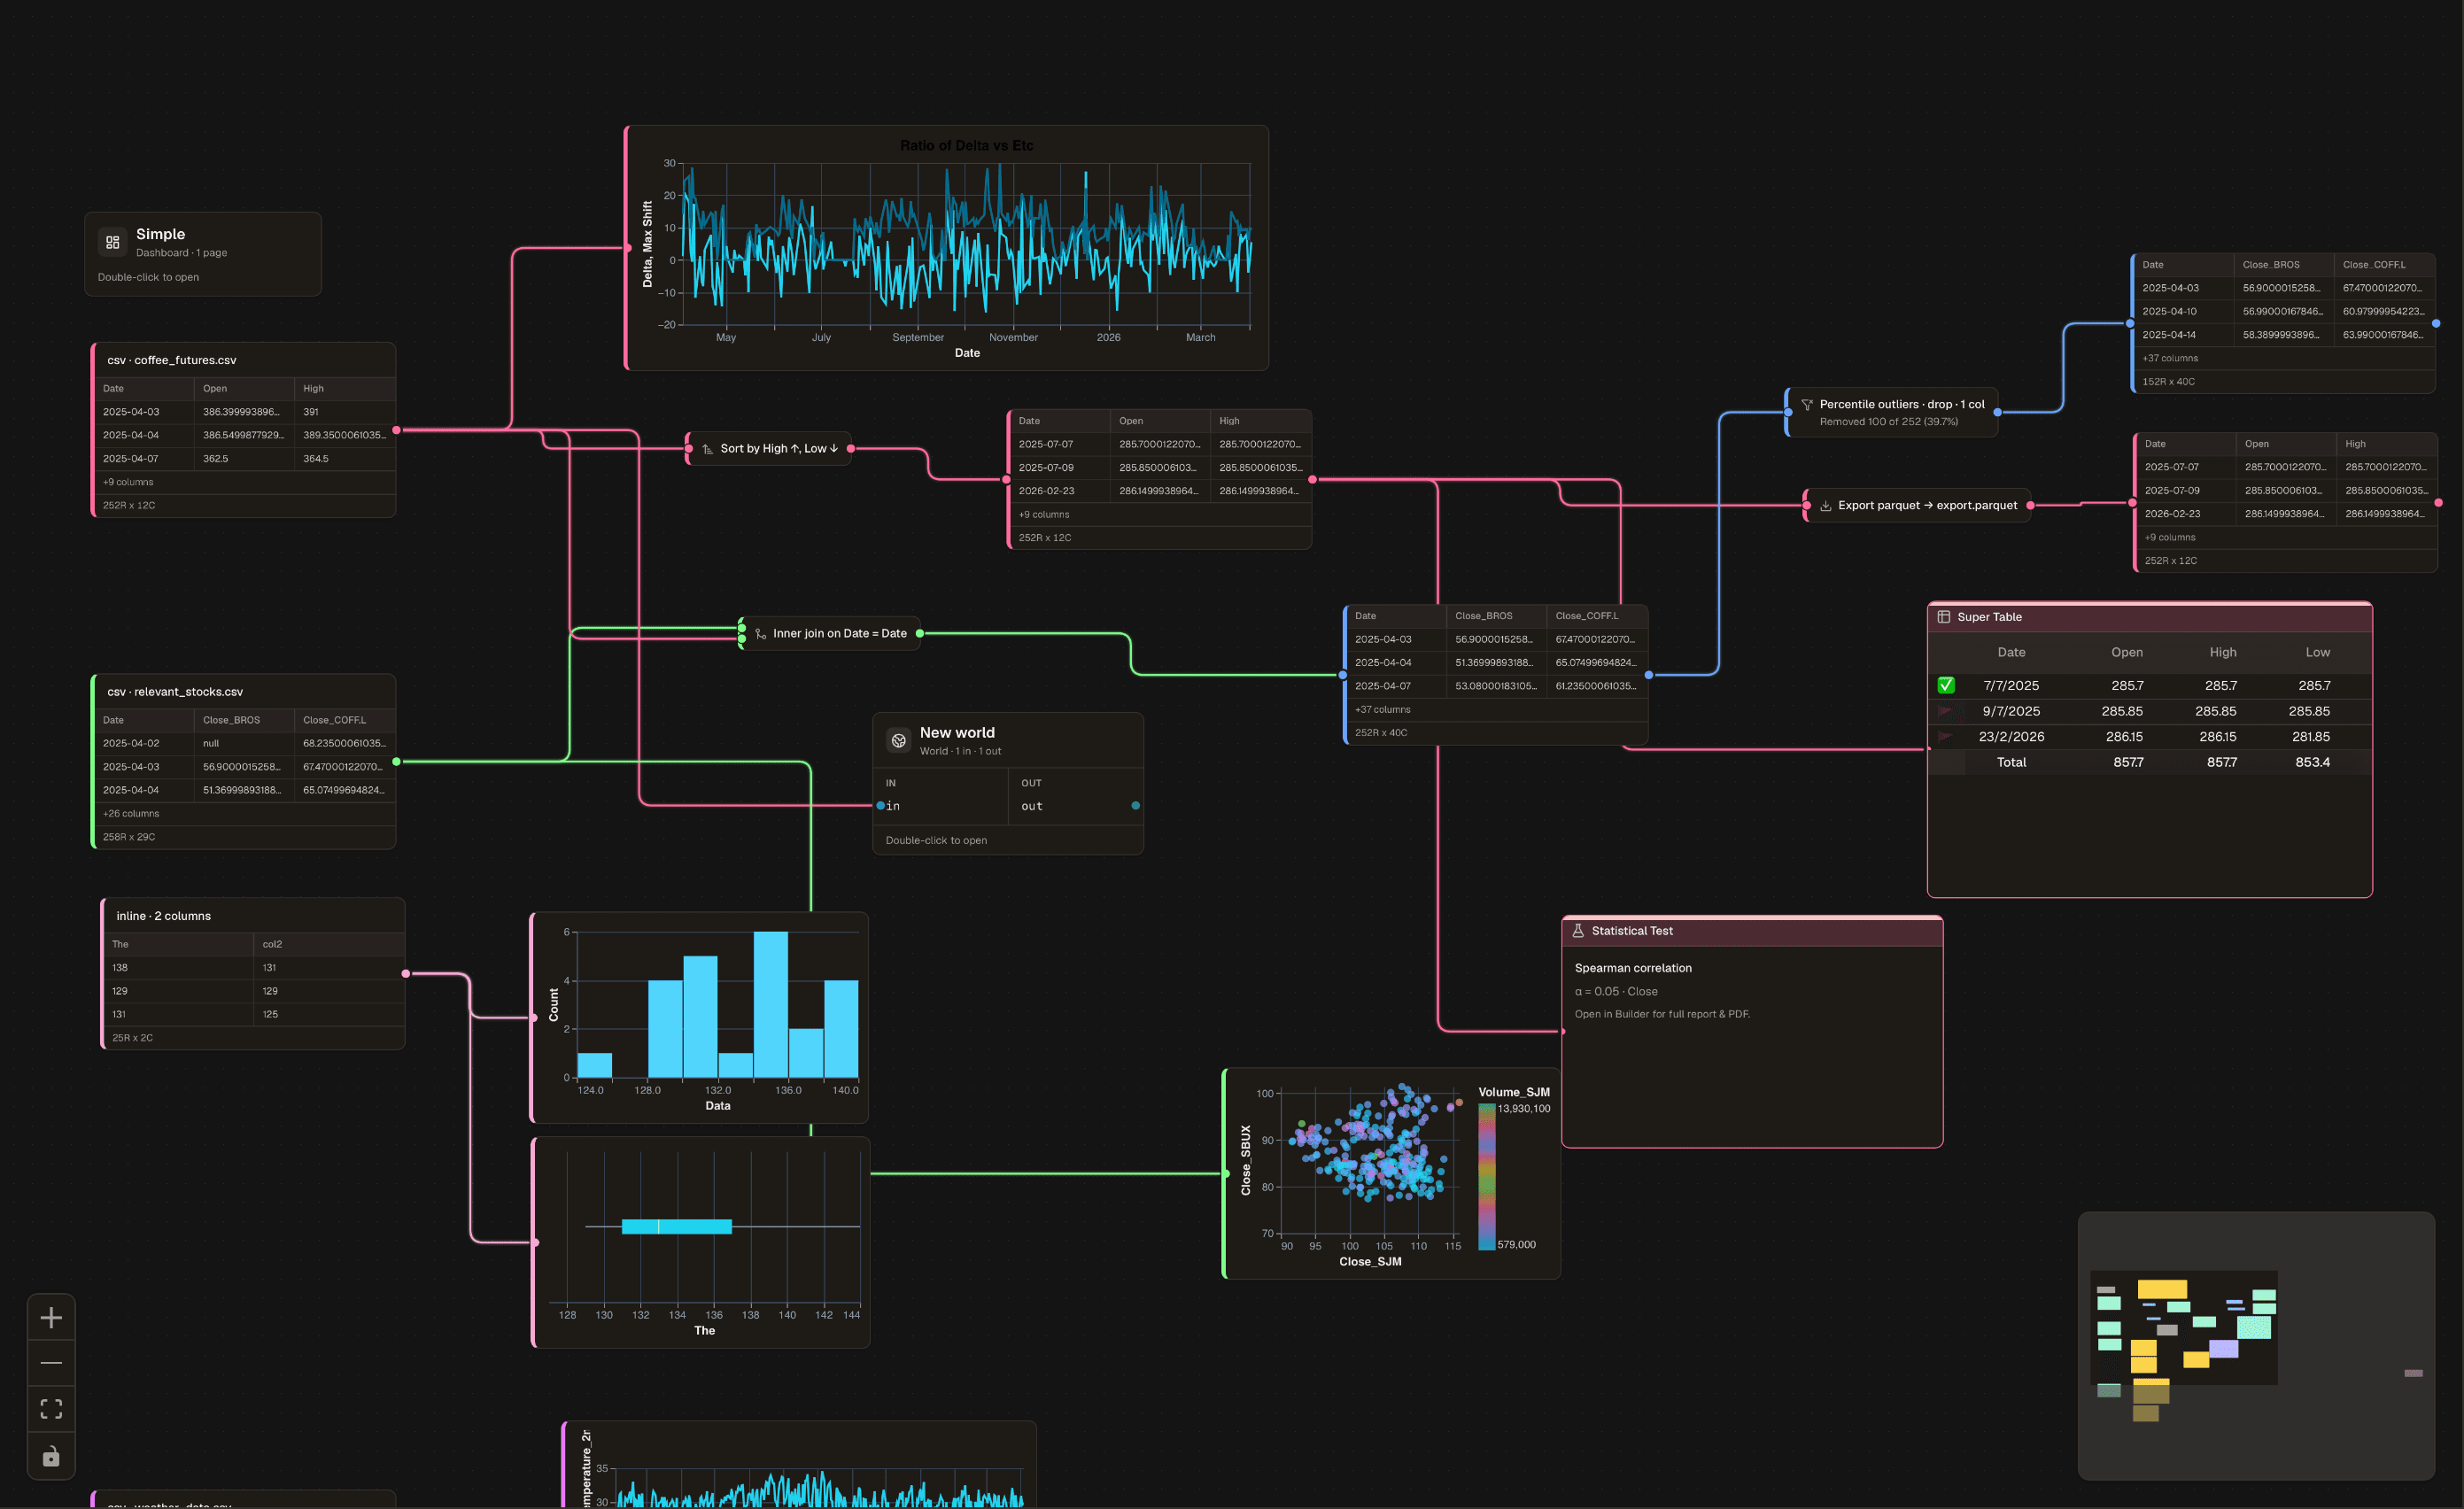

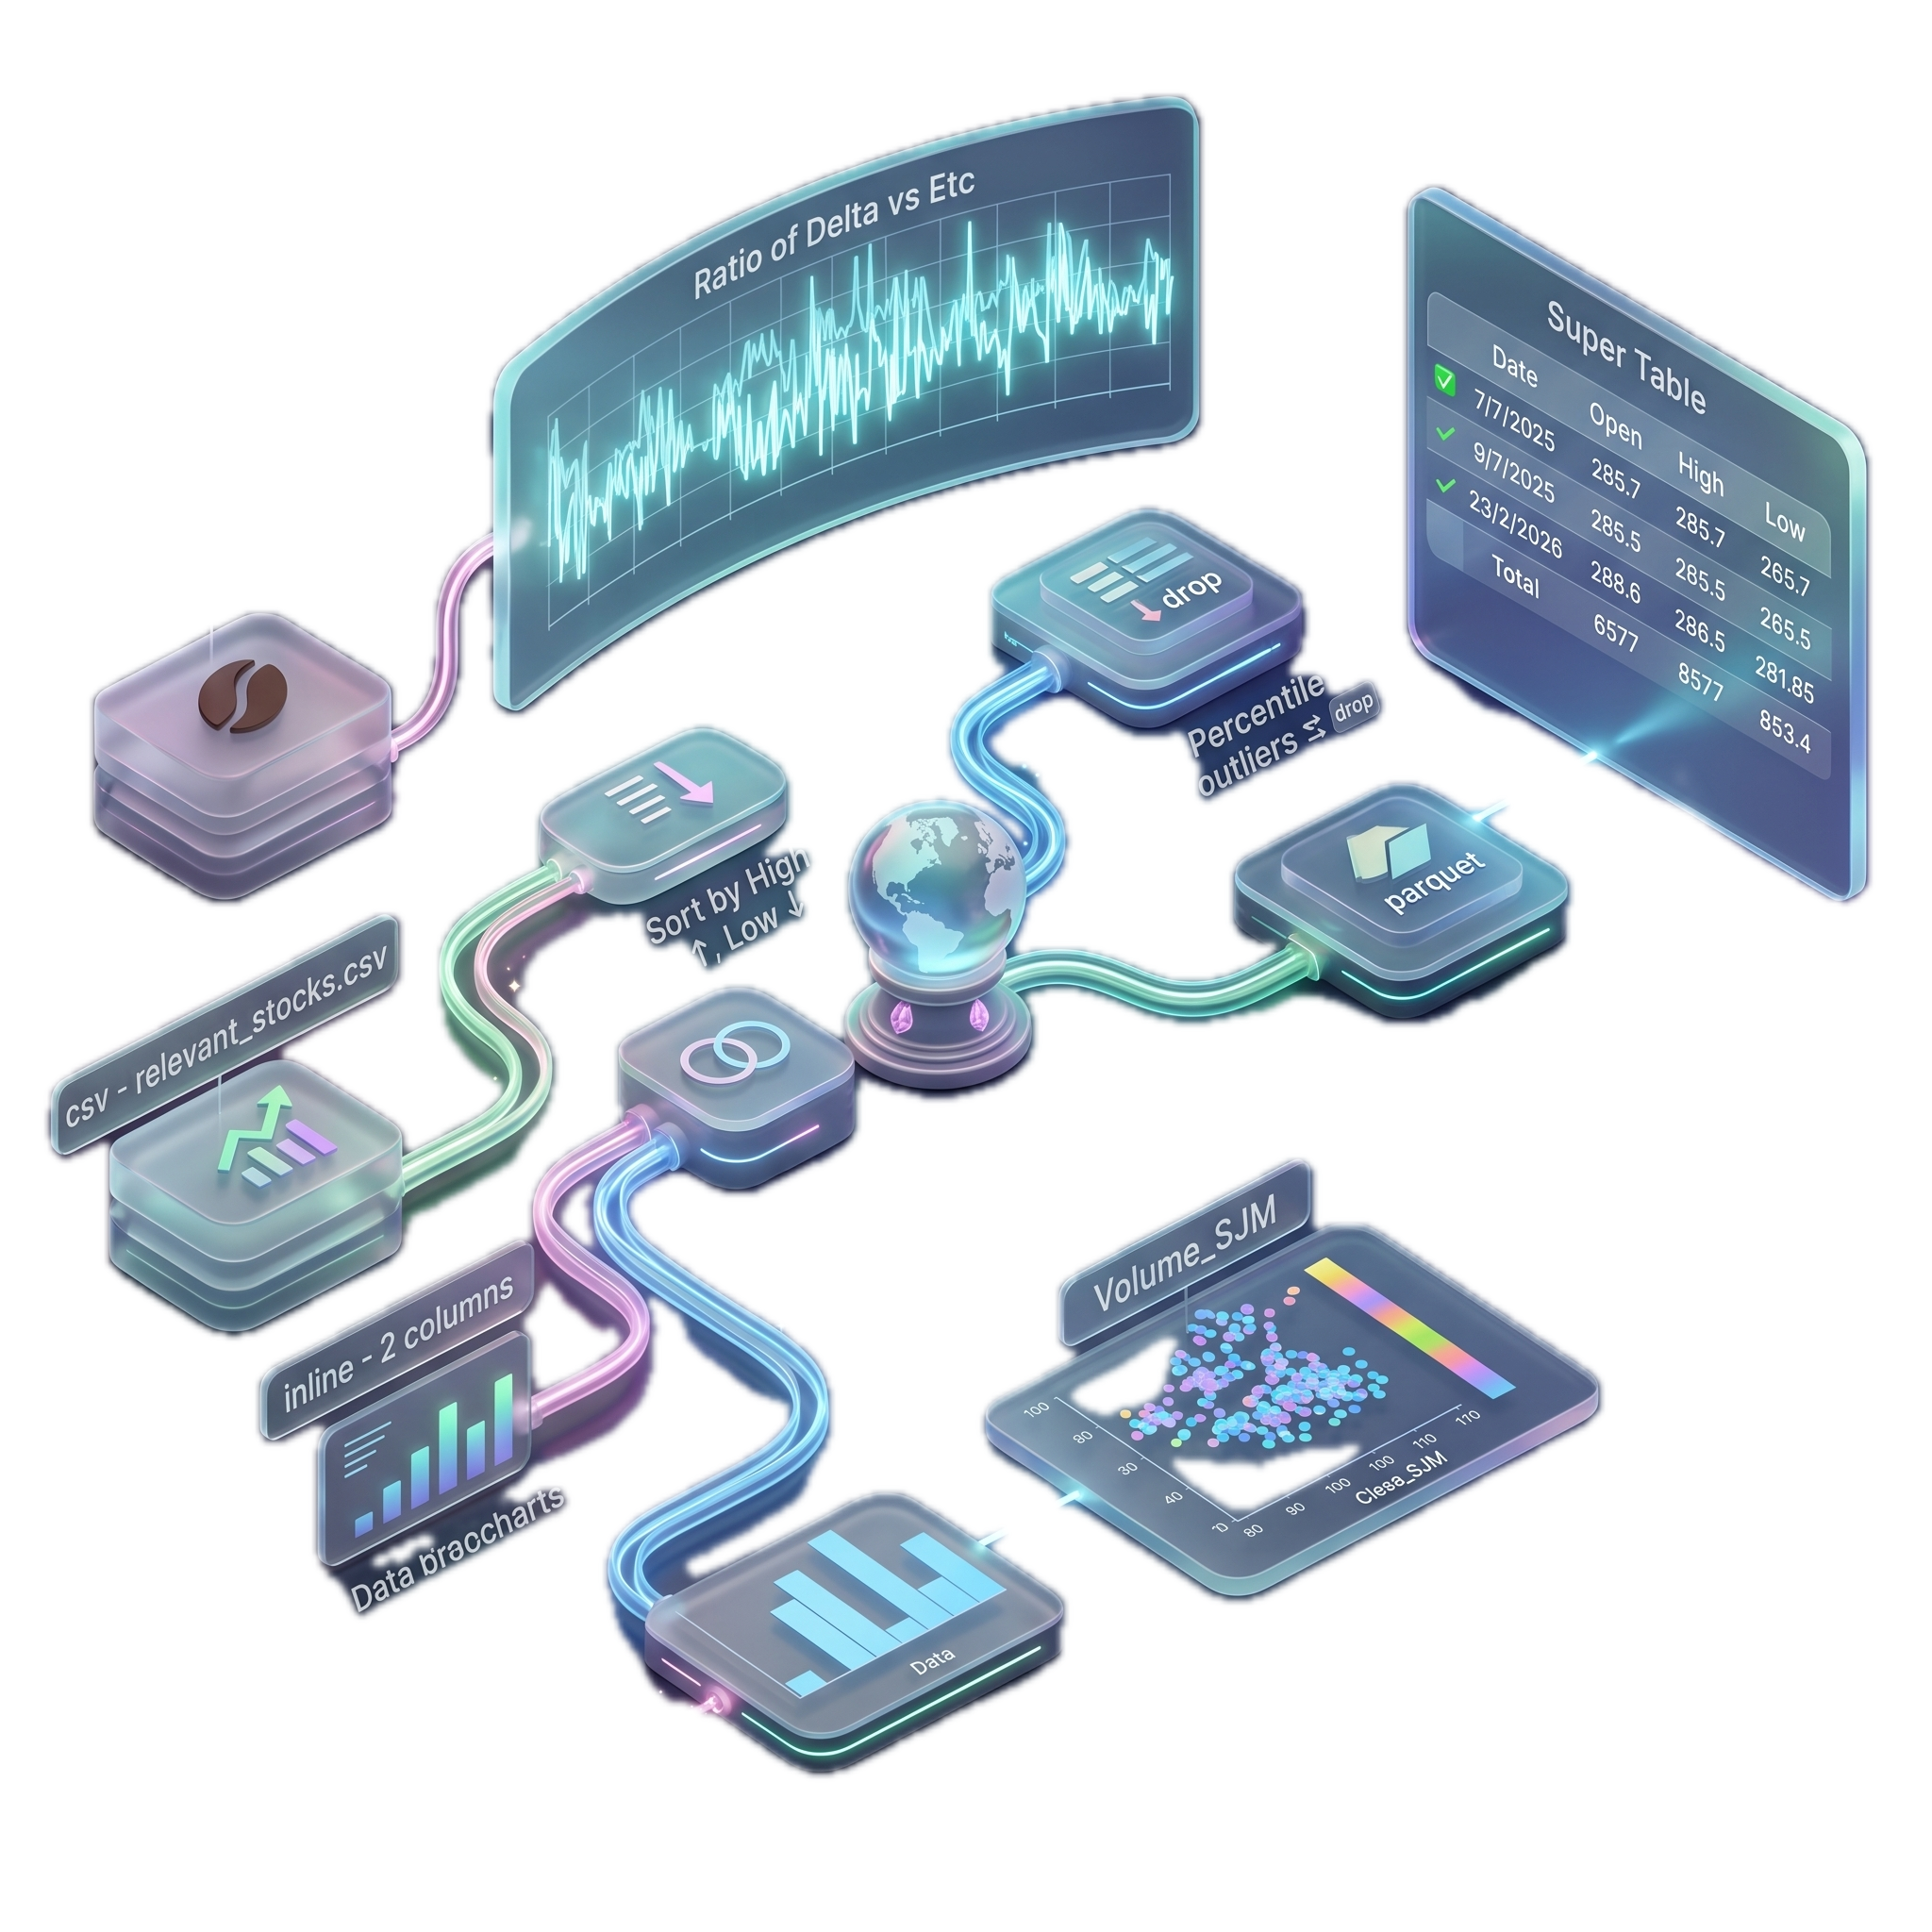
A visual workflow tool for data work — closer to n8n than to a notebook.
Spreadsheets, notebooks, and BI tools each solve a slice of the job — and leave the rest to glue work.
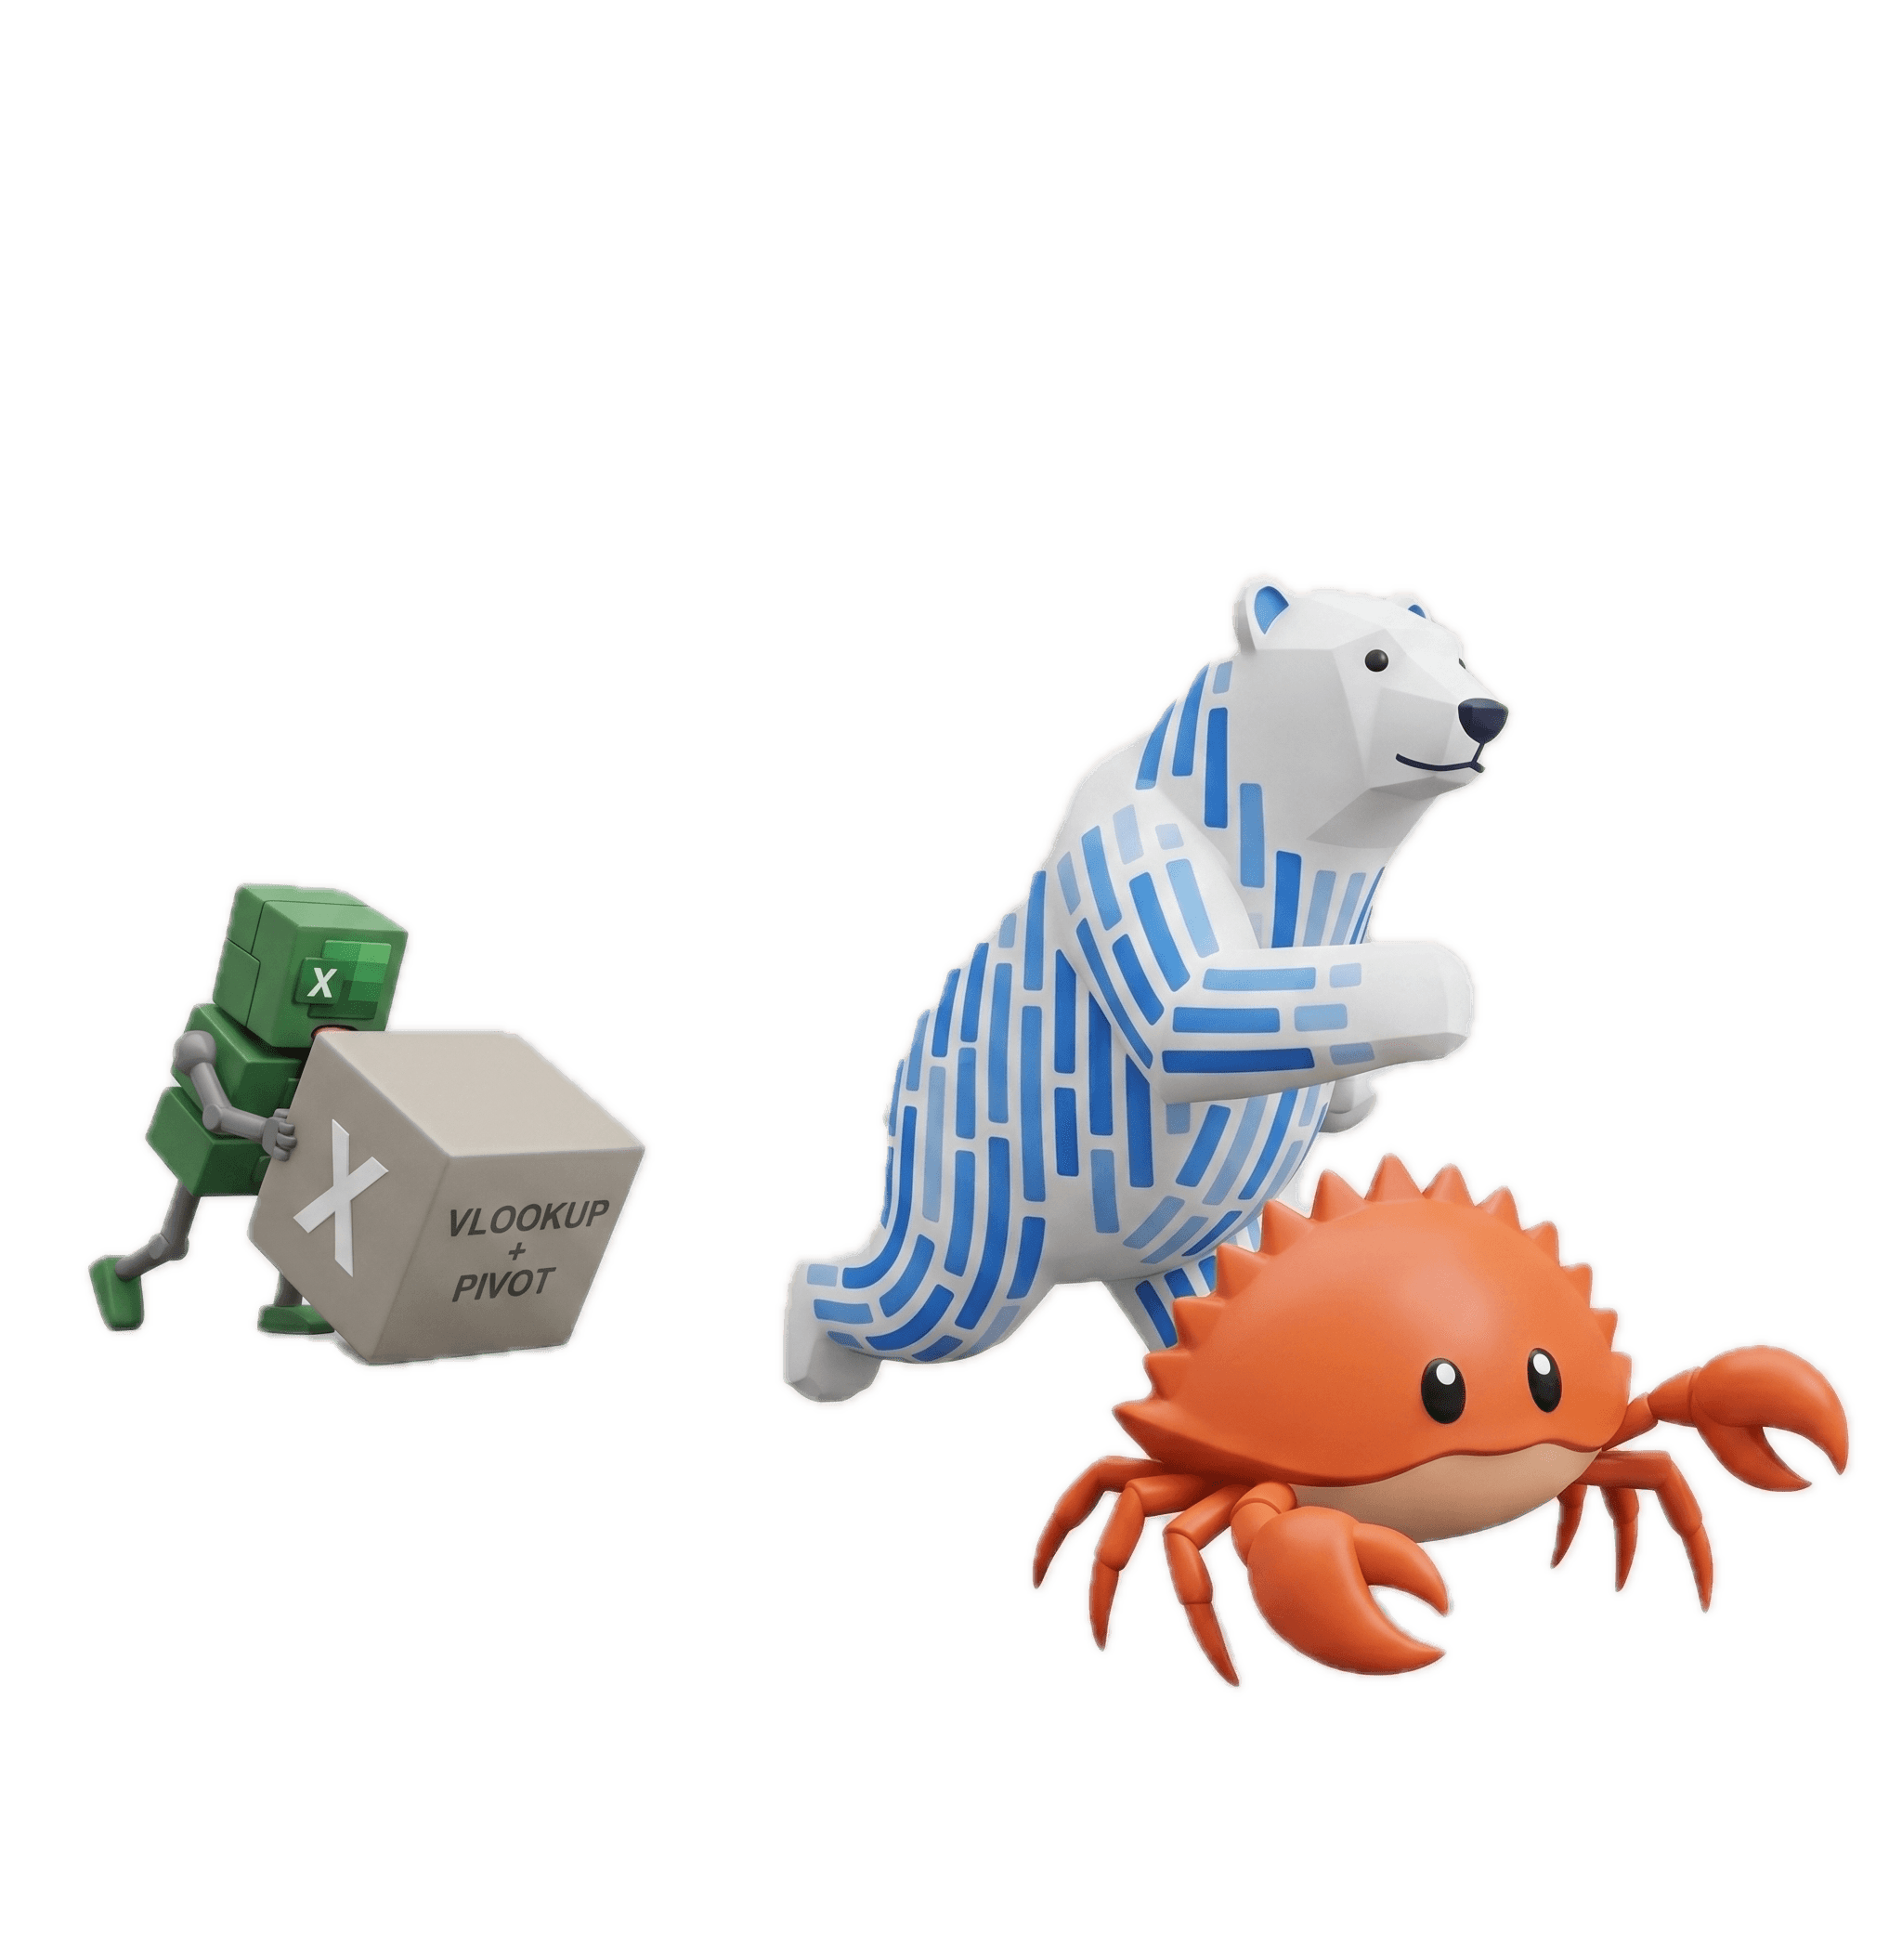
Instead of Excel
Rust and Polars under the hood — built for large datasets, not spreadsheet ceilings.

Instead of Jupyter & R
Node-edge workflows with exploratory branching — not a linear notebook.

Instead of Power BI
Charts and dashboards live on the board — no export to a separate BI tool.
Stats, dashboards, and math — on one board. No handoff between tools.
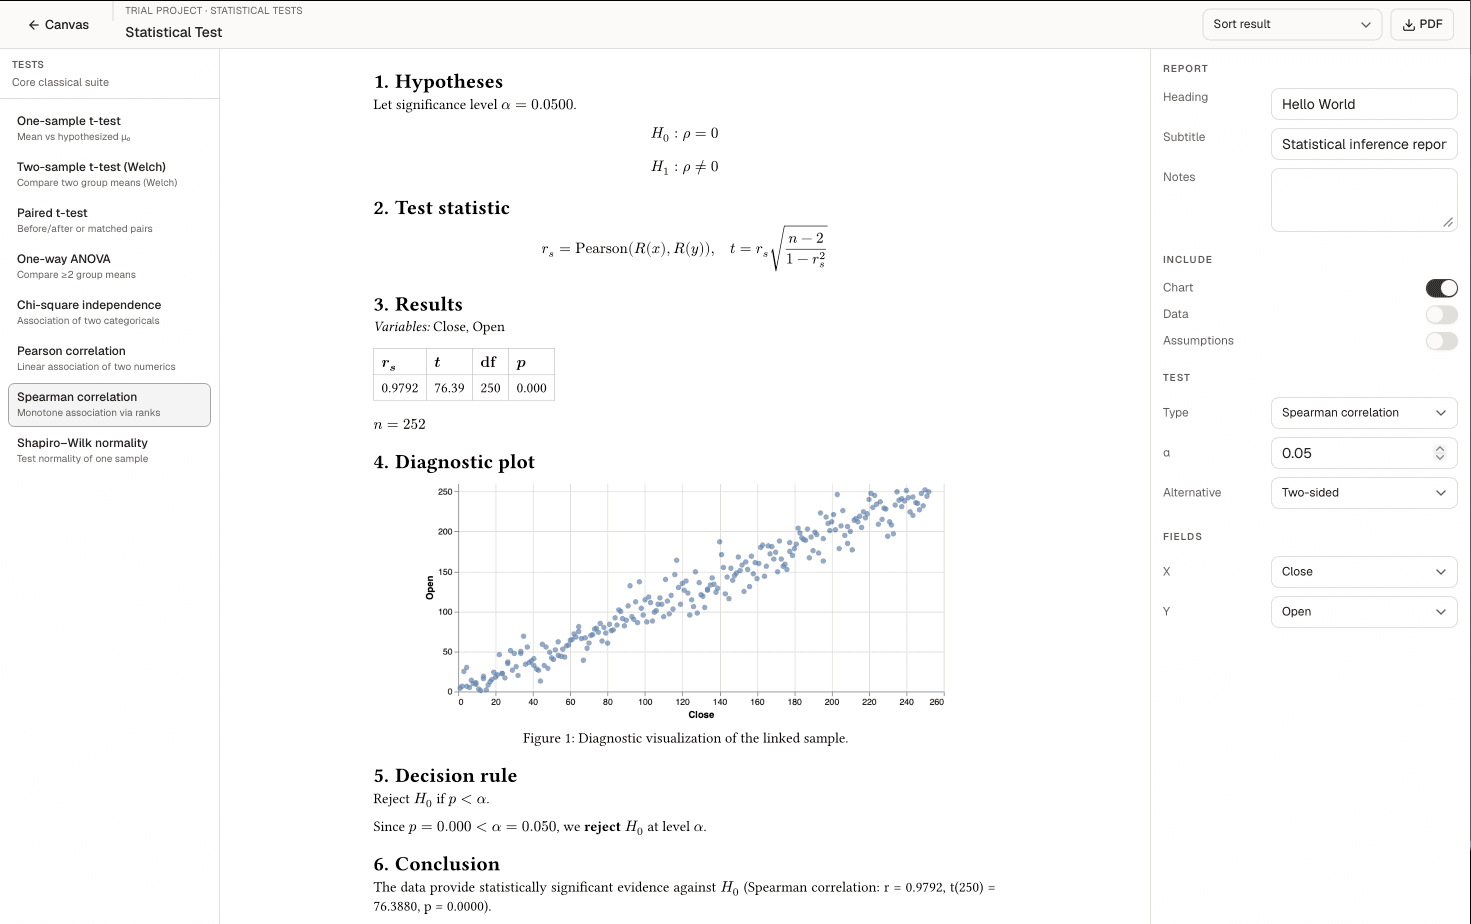
Run the same tests you’d reach for in R — without leaving the canvas.
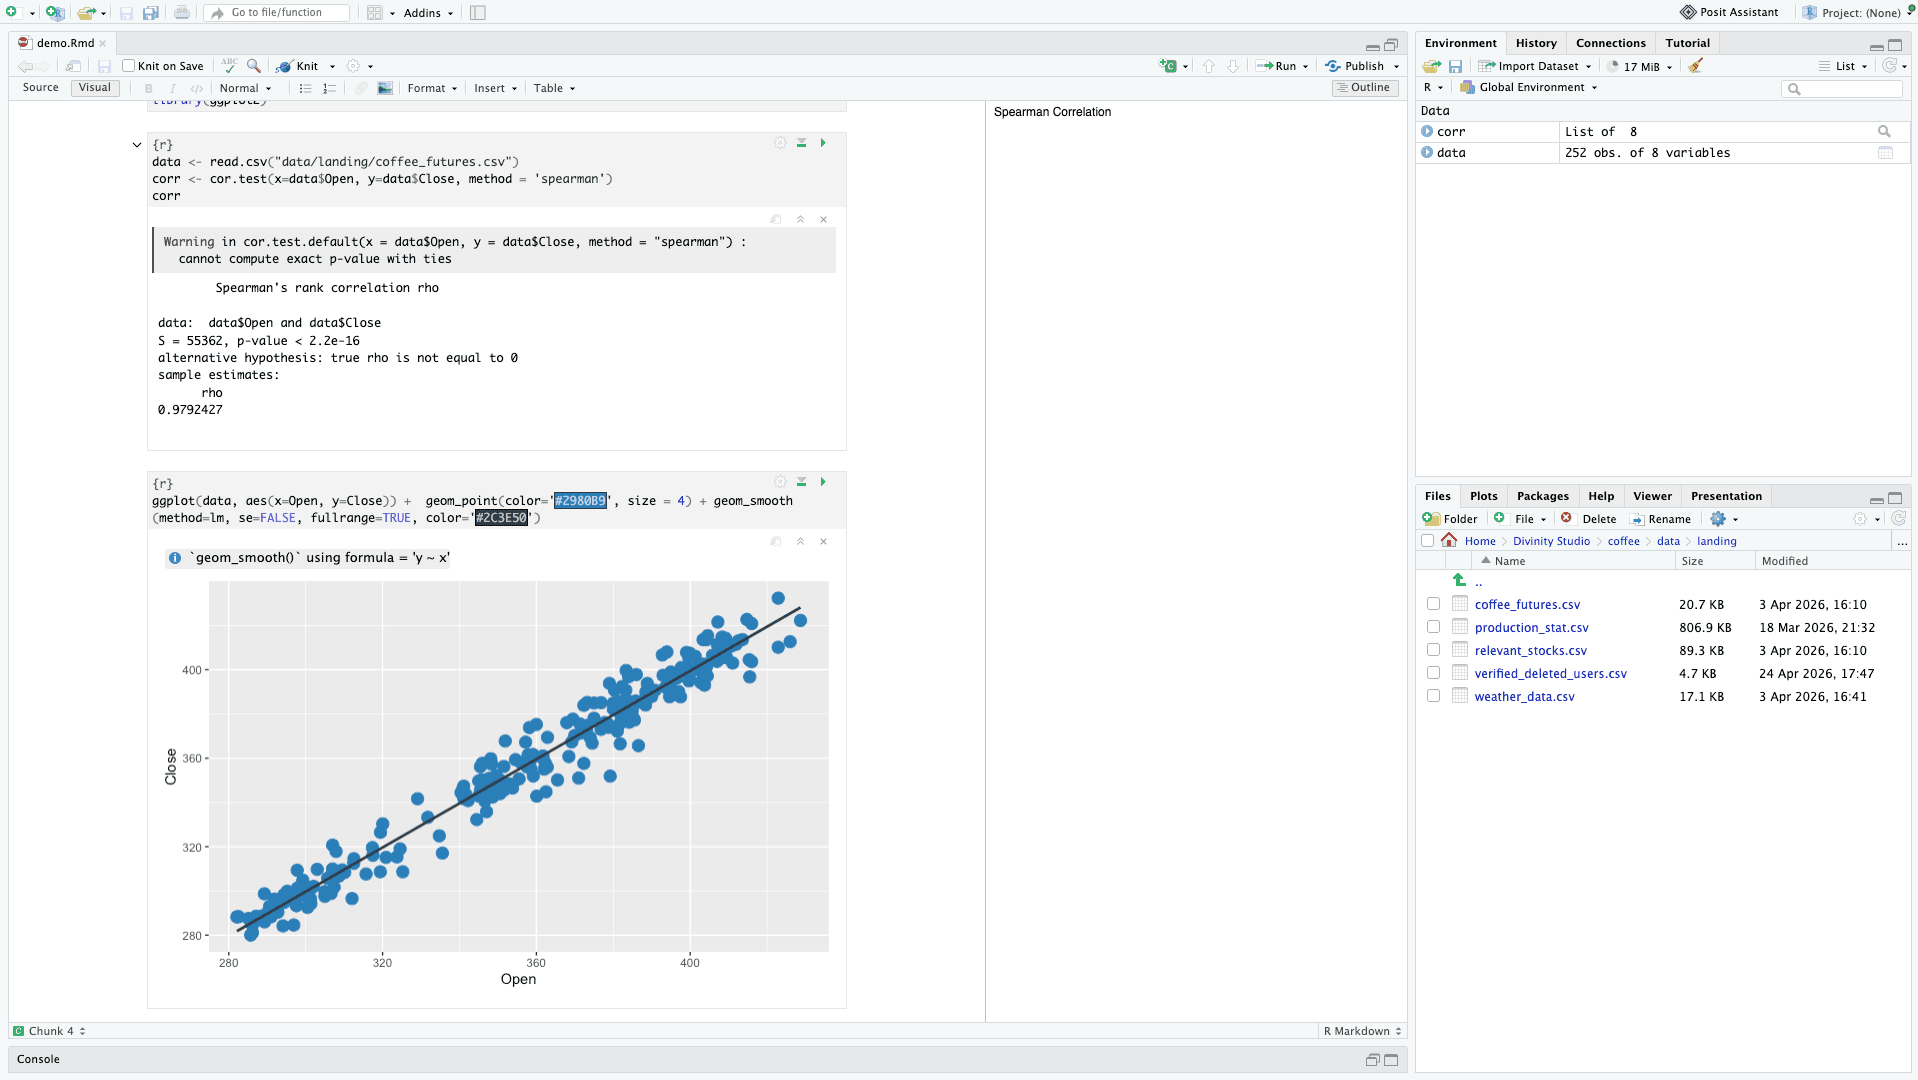
Drag to compare
Build interactive dashboards on the board, instead of exporting to a BI tool.
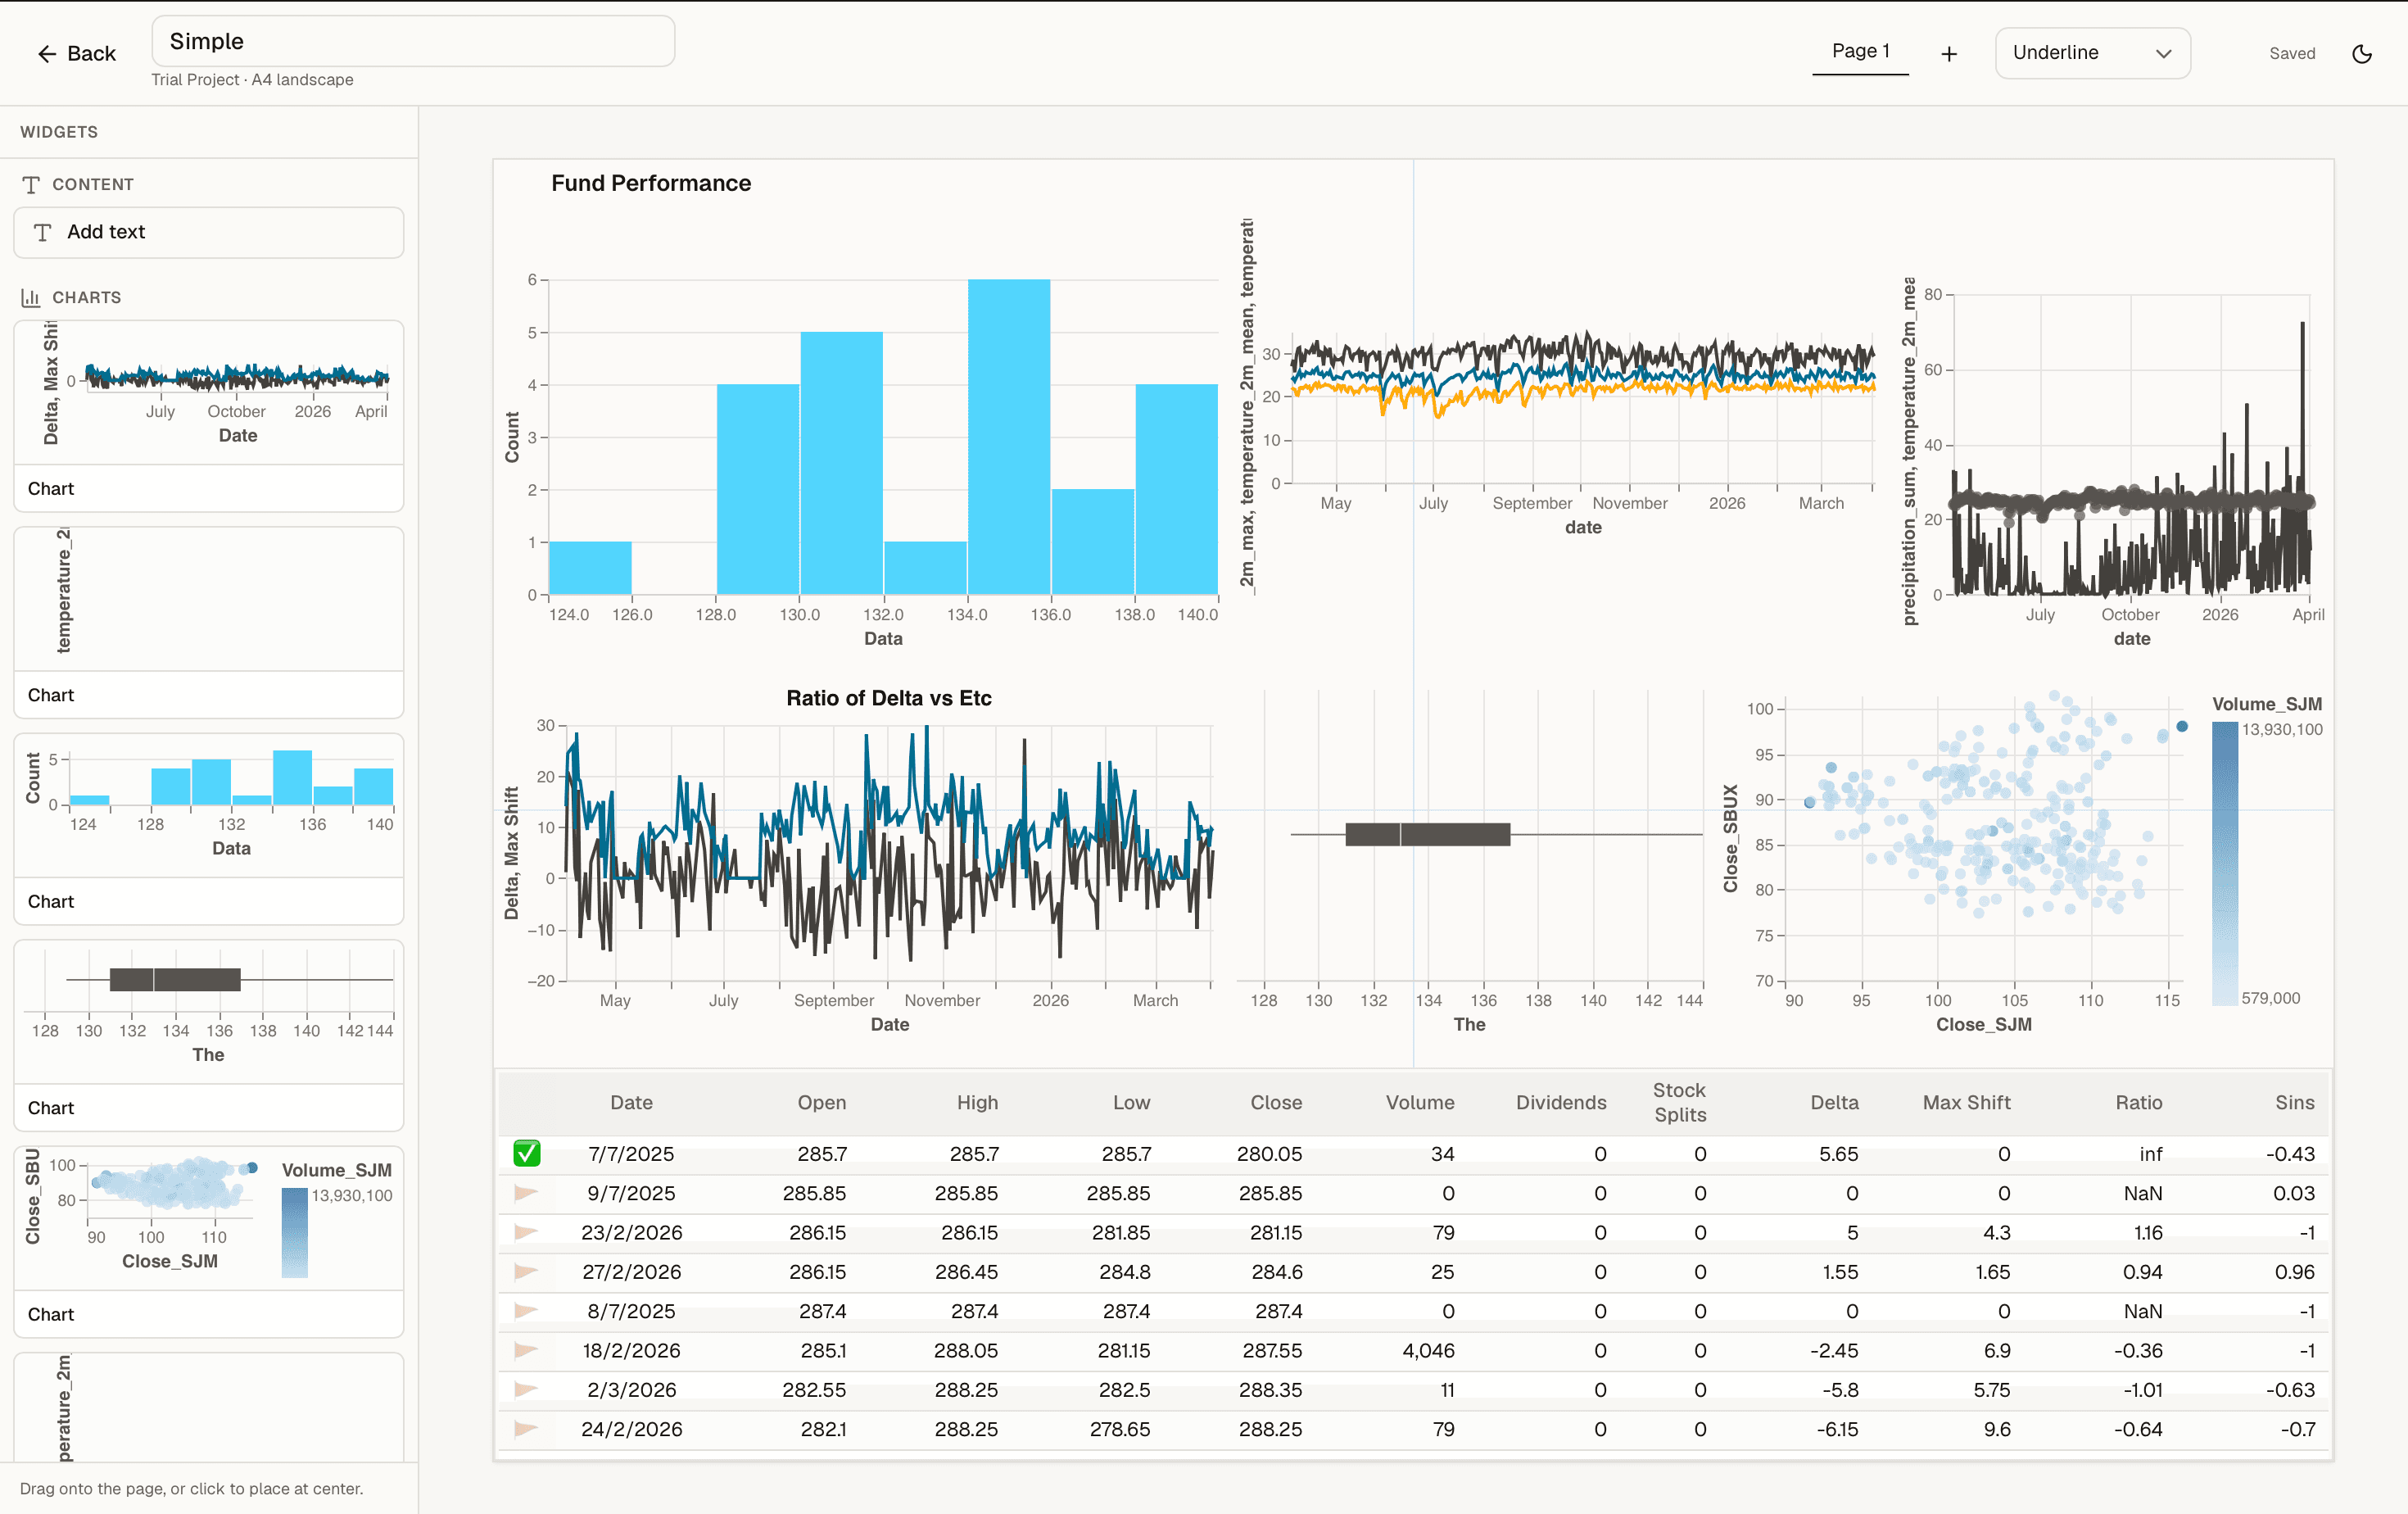
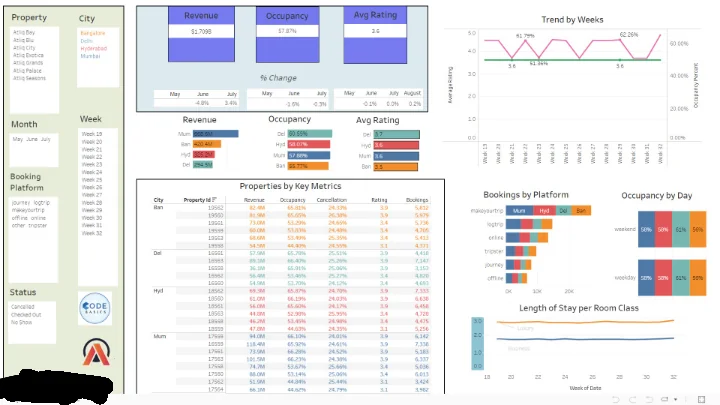
Drag to compare
Complex formulas stay readable — closer to math than to a spreadsheet cell.
Excel — complex formula screenshot
Tinker — formula / LaTeX on the canvas
Real analysis rarely goes in a straight line. You try an idea, branch off, abandon a path, come back with a better question.
Notebooks and dashboards push you toward a single finished answer. Tinker is shaped for the messy middle — experimentation, side trails, and the kind of tinkering that turns a hunch into something you can trust.

First built for the public markets team at a Melbourne VC fund.
Before / after — deal analysis workflow
7h → 15m
Time to run initial analysis on a prospective investment.
Quarterly update — instant refresh demo
3h → instant
Quarterly update process, refreshed from the board.

Software engineer for 10+ years. Started coding at 13; by 15 had launched a startup that grew to over 20,000 partners.
Worked data workflows at TasWater and at a Melbourne VC — the same friction across both. Tinker is what was missing.
Join the beta if you want to try the canvas.